Welcome to my chart portfolio. Here you'll find visualisations to explore data, uncover patterns, and communicate insights clearly.
CC1. Hosting. Display charts in your own site.
Below are two economic indicators displayed side by side.
CC2. Building. Create your own visualisations
CC3. Debate. Use a visualisation in policy commentary
Should UK prioritise regional investment over London, given capital's high housing unaffordability despite highest salaries?
Chart 1
Chart 2
Despite highest earnings, Londoners need eleven years' income for homes versus five in the North East.
CC4. Replication. Re-create, then improve someone else's chart.
The original chart
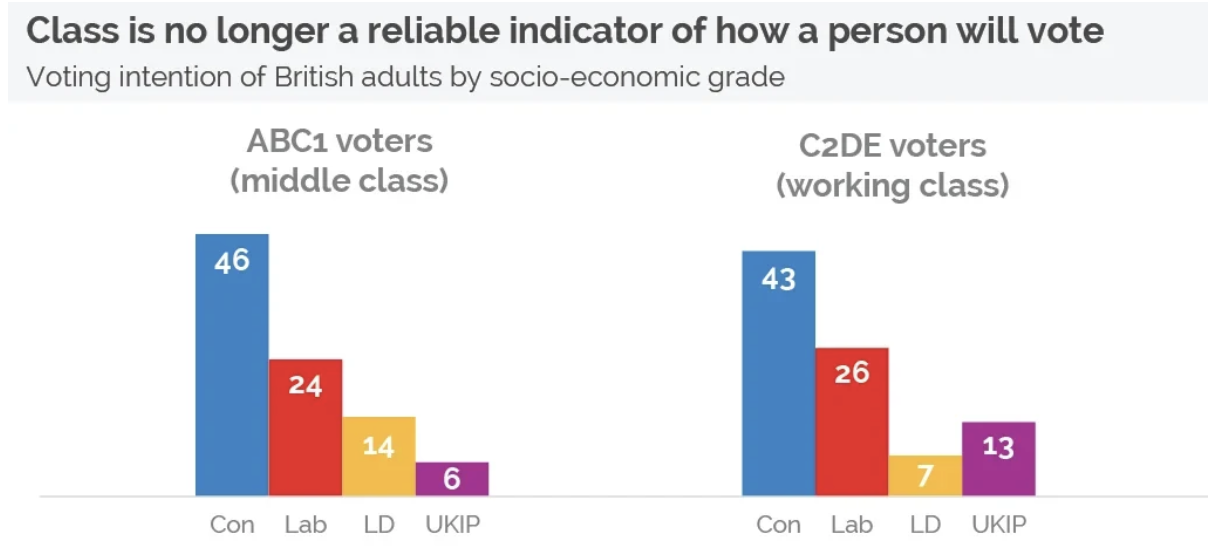
Chart 1. Replication using Vega-Lite
Chart 2. Improved version